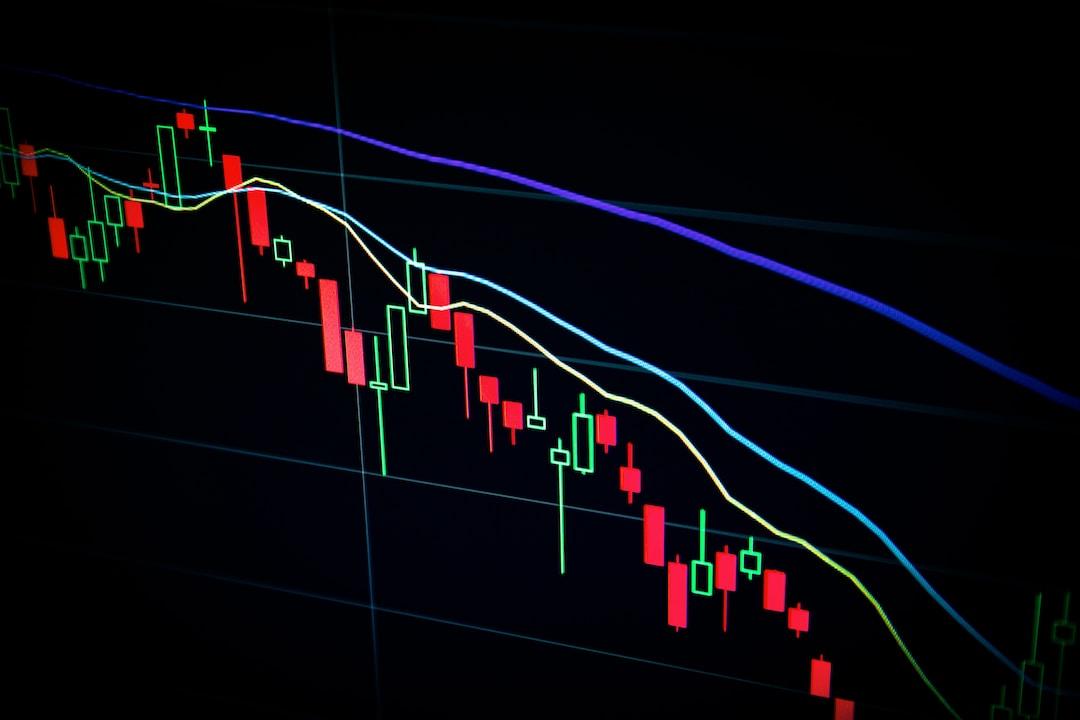
Candlestick charts have stood the test of time and become an essential tool in any trader’s arsenal. Their history goes back to 18th-century Japan, but their relevance in today’s highly volatile markets has only grown. With varying shapes and patterns they create, candlesticks paint a definitive picture of supply and demand. Today, learning how to read these charts is critical for any trader. In this article, we’ll take a deep dive into the world of candlestick charts.
Understanding the Basics of Candlestick Charts

The first step towards mastering candlestick charts is understanding their basic structure. Unlike line charts, each “candle” in a candlestick chart represents four critical pieces of information within a set timeframe: the opening and closing prices and the highest and lowest points the price reached in that period. The “body” of the candlestick shows the opening and closing prices, while the “wick” or “shadow” shows the trading range.
Each candlestick can be either bullish (increasing in value) or bearish (decreasing in value). Bullish candlesticks, where the closing price is higher than the opening price, are often represented by a clear or green color. Conversely, bearish candlesticks, where the closing price is lower than the opening price, are often represented in red or are filled in.
The length of the body and wick give traders an idea about the strength and sentiment in the market. A long body coupled with short wicks indicates strong buying or selling pressure. On the other hand, a short body with long wicks indicates a mixed sentiment or indecisiveness in the market.
Decoding Popular Candlestick Patterns
There are several common candlestick patterns that traders need to be familiar with. These patterns can be a powerful signal of potential market reversals or continuations. Three commonly used patterns include Hammer, Doji, and Engulfing.
The Hammer is a bullish signal that occurs during a downtrend. It is formed when the opening, high, and closing prices are roughly the same. Additionally, there is a long lower wick, which suggests that the market rejected lower prices. The Doji is an indecision pattern that is formed when the opening and closing prices are almost the same, indicating that neither bulls nor bears could gain control.
The Engulfing pattern consists of two candlesticks. The first one is smaller and is engulfed by the second one. A bullish engulfing pattern happens in a downtrend and signals a possible trend reversal. It happens when a small, bearish candlestick is followed by a large, bullish candlestick.
Application of Candlestick Charts in Different Markets

Candlestick charts are highly versatile and can be applied in various markets, be it forex, stocks, commodities, or indices. In forex trading, for example, candlestick patterns can give traders vital information about potential opportunities or threats. On a busy forex chart, the immense amount of data can be overwhelming. Candlestick patterns, therefore, serve as a navigational beacon, offering clear indications of trend reversals or continuations.
Similarly, stock market traders often use candlestick patterns in their technical analysis. Understanding these patterns can signal possible price movements, providing traders with an opportunity to make informed decisions. Observing patterns like the ‘Cup and Handle,’ ‘Head and Shoulders,’ or ‘Double Top’ can indicate bullish or bearish trends, respectively.
In commodity trading, volatility often leads to price gaps on standard bar charts. However, candlestick patterns will fill in these gaps, offering a seamless view of price action. For traders invested in indices like the S&P 500 or Nikkei 225, a well-plotted candlestick chart can aid in strategic decision-making, illuminating the overall sentiment in the market.
Trading Strategies Involved With Candlestick Charts
Candlestick charts form the backbone of numerous trading strategies due to their ability to provide significant market insights. From simple strategies involving a single chart pattern to complex ones incorporating various patterns and indicators, these charts are integral to both beginner and seasoned traders.
One of the simplest strategies is trading on a bullish engulfing pattern during a downtrend. The trader waits until a bullish engulfing pattern is formed and enters a long position, expecting the price to increase. A more advanced strategy could involve combining candlestick patterns with trend lines and resistance levels. When a bullish reversal pattern is formed near a support level, the trader may enter a long position.
Traders often add additional indicators to their strategy, such as the Moving Average Convergence Divergence (MACD) or the Relative Strength Index (RSI). When these indicators align with a strong candlestick pattern, it strengthens the signal and increases the probability of a successful trade.
Altogether, candlestick charts are versatile tools that, once understood well, can steer traders and investors into making informed decisions based on the behavior of the stock market. Its importance in predicting short and medium-term price directions in uncertain market conditions should not be underestimated. Gaining proficiency in reading and interpreting these charts can significantly increase traders’ chances of making profitable trades.